Optimization, funding & costs
Which metric to prioritize, how to simulate a funding challenge, realistic costs and quality filters.
An exploration tests thousands of indicator and parameter combinations, but which result is «the best»? That depends on the objective you choose and how realistic the costs applied to the backtest are. In this article you'll fine-tune both: the optimization criterion and the cost parameters, so the algorithms the exploration delivers are aligned with your real goal — whether passing a funding challenge or building a solid long-term equity curve.
Optimization objective
The optimization objective is the metric the exploration tries to maximize (or minimize) when comparing combinations. Choosing it well makes the difference between finding a robust algo and one that only looks good on paper.
| Objective | What it maximizes / minimizes |
|---|---|
| Balanced score (default) | Weighted blend of Sharpe, drawdown and profit factor. Good for general-purpose goals. |
| Highest Sharpe Ratio | Return adjusted by total volatility of daily returns. |
| Highest Sortino | Like Sharpe, but only penalizes downside volatility (ignores positive volatility). |
| Highest Calmar | Annualized return divided by maximum drawdown. Ideal if controlling drawdowns is a priority. |
| Highest absolute PnL | Total profit in USD, unadjusted for risk. May favor aggressive algos. |
| Lowest Drawdown | Minimizes the worst drop from peak equity. Useful for prop firm accounts with DD limits. |
| Highest Profit Factor | Gross profit divided by gross loss. Greater than 1 means you earn more than you lose in total. |
| Highest Expectancy | Average profit per trade. Favors algos with high signal quality, even if they have few trades. |
| Highest Win Rate | Percentage of winning trades. High win rate doesn't guarantee profitability if losses are too large. |
| Highest Recovery Factor | Total PnL divided by maximum drawdown. Measures how much you earned per dollar of maximum drop. |
| Highest funding pass rate | Percentage of funding challenge simulations that would be approved. Requires enabling the «Funding» section. |
If your goal is to pass a prop firm challenge, choose «Highest funding pass rate» and configure the challenge rules in the «Funding» tab. For general robustness, the balanced score (default) is the best starting point.
Funding challenges (prop firms)
Prop firms require you to follow strict rules to get capital: reach a profit target, not exceed a maximum daily loss, not surpass a total drawdown and trade for a minimum number of days. The exploration can simulate that scenario for you.
When you activate the funding simulation, the exploration takes each candidate algorithm, «runs» it many times over historical data (with varying conditions) and calculates what percentage of those runs would have passed the challenge rules. That percentage is the «pass rate». A pass rate of 80% means the algo would have passed the challenge in 8 out of 10 simulated attempts.
- 1
Enable the «Funding» section
In the exploration settings you'll find a «Funding» or «Prop firm» block. Enable it to see the fields.
- 2
Define the challenge rules
Enter the starting capital, the profit target (e.g. 8%), the maximum daily loss (e.g. 4%), the maximum total drawdown (e.g. 10%) and the minimum trading days (e.g. 5). Copy the exact values from the prop firm you're targeting.
- 3
Select «Highest pass rate» as objective
In the «Optimization» tab, choose «Highest funding pass rate». The exploration will prioritize algos that most often would have passed the simulated challenge.
- 4
Interpret the pass rate
A very high pass rate (>90%) may indicate that the challenge rules are easy for that algo, or that the algo is over-fitted to the period. Combine the pass rate with DSR and Walk-Forward to confirm.
An algo with a 95% pass rate but very low DSR probably got lucky statistically in that period. Don't deploy it live until you validate it with Walk-Forward and Multiverse.
Advanced exploration settings
In addition to the instrument, timeframe and dates, the exploration exposes settings that modify how candidate algorithms manage risk. Use them to fine-tune exit behavior and position sizing.
- Fixed Risk/Reward (fixedRR): forces all candidate algos to use a predefined R:R ratio (e.g. 1:2) in their exits. Useful if you want to compare combos without R:R being a free variable.
- Dynamic risk multiplier (riskMultiplier): scales position size according to market conditions or recent results. A multiplier >1 increases risk in favorable conditions; <1 reduces it in adverse conditions.
- Breakeven modifier: adjusts at what distance from the entry price the stop is moved to breakeven. Lower values activate it sooner (more protection, less potential).
- Trailing stop modifier: controls the aggressiveness of the trail (how closely the stop follows price). A very tight trail closes faster, capturing less of the trend.
- Averaging (averagingConfig): allows adding units to an already-open position when price moves against you (averaging down) or in your favor (pyramiding). It can multiply gains but also losses.
Averaging is an advanced and risky technique: if price doesn't come back, the position grows and losses are amplified. Only use it if you understand the instrument well and have a clear emergency stop.
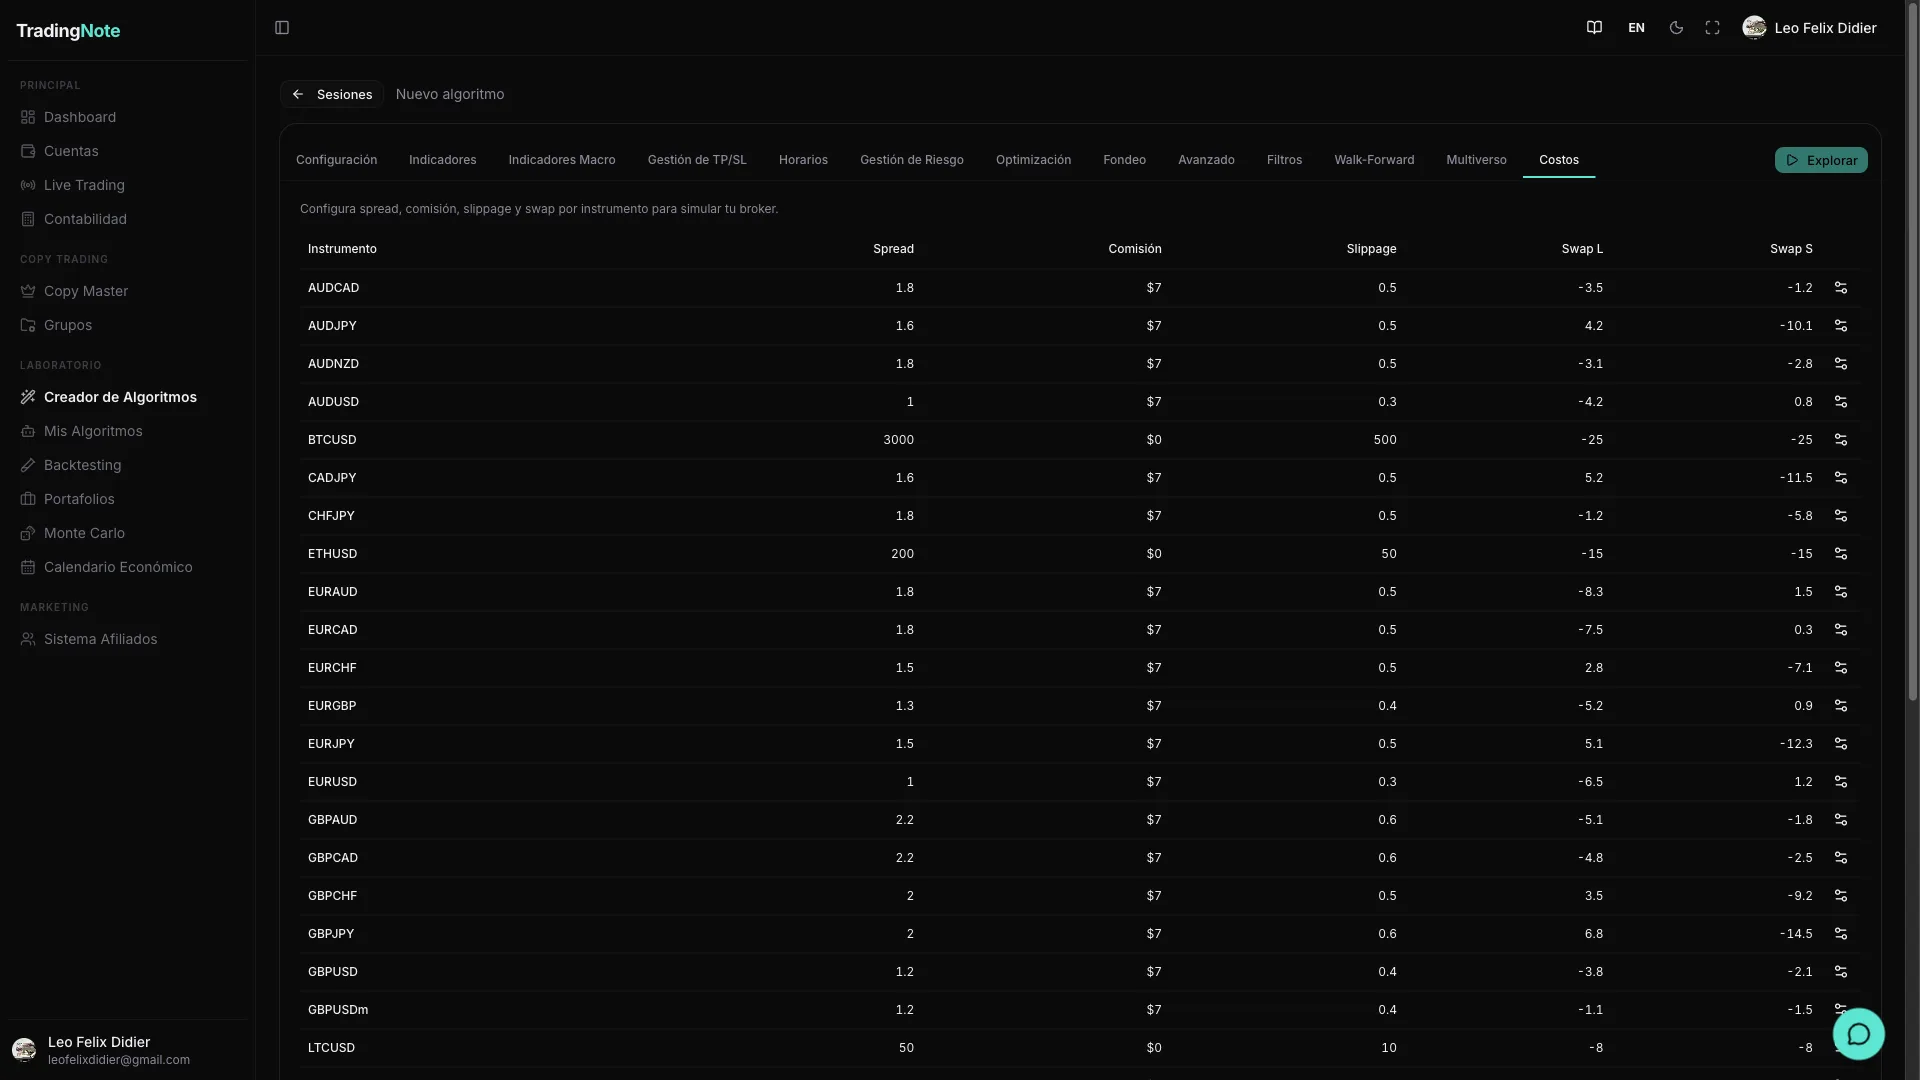
Realistic costs: spread, commission, slippage and swap
Each backtest applies costs per instrument: spread (the bid/ask difference you pay on entry), commission (the fixed charge per trade), slippage (the difference between the price you see and the one you get in real execution) and swap (the cost of holding positions overnight). You can view and edit these values in the «Instrument costs» section inside the exploration settings.
| Instrument | Spread (pips) | Commission (USD) | Slippage (pips) | Swap Long | Swap Short |
|---|---|---|---|---|---|
| EURUSD | 1.5 | 0 | 1 | -0.5 | 0.3 |
Default values reflect typical conditions for a liquid market during European hours. You can edit each row to match your actual broker, or press «Reset» to return to the instrument's default values.
An algo that shines without costs almost always deflates when you apply real spread, slippage and commissions. Don't lower these values to «improve» the numbers: you'd be fooling yourself and the algo will fail live. Always use costs equal to or slightly higher than real ones.
Quality filters
When the exploration finishes, the platform doesn't save all candidates: only those that pass a set of minimum quality thresholds. This prevents you from accumulating fragile algorithms with no statistical basis.
| Filter | What it's for | Typical value |
|---|---|---|
| Minimum Sharpe | Discards algos with low returns relative to their volatility. A Sharpe <1 indicates the risk taken isn't worth it. | 1.2 |
| Maximum drawdown | Removes algos that in the past had drops that were too deep. Essential if you're trading with a prop firm. | 15% |
| Minimum Win Rate | Ensures a minimum percentage of winning trades. Helps filter algos that only «win» due to a few large trades. | 50% |
| Minimum DSR (Deflated Sharpe Ratio) | Corrects Sharpe for the number of combinations tested in the exploration. A high Sharpe obtained after testing 10,000 combos may be pure luck; DSR discounts that. A high DSR (>0.5) indicates the algo is not just search luck. | 0.3 (minimum) — aim for >0.5 |
Setting the filters too high can leave you with zero results. If an exploration returns no algorithms, start by relaxing the minimum Sharpe or maximum drawdown. You can also extend the date range so the search has more data to work with.
Once you have candidates that passed these filters, the next step is to validate them: run Walk-Forward to verify the algo generalizes outside the training period, and Multiverse to simulate dozens of alternative market scenarios. Check the article «Validation: Walk-Forward and Multiverse» to continue.