Exploration setup
Which instrument, timeframe, dates and capital to use, and whether to run a random or genetic search.
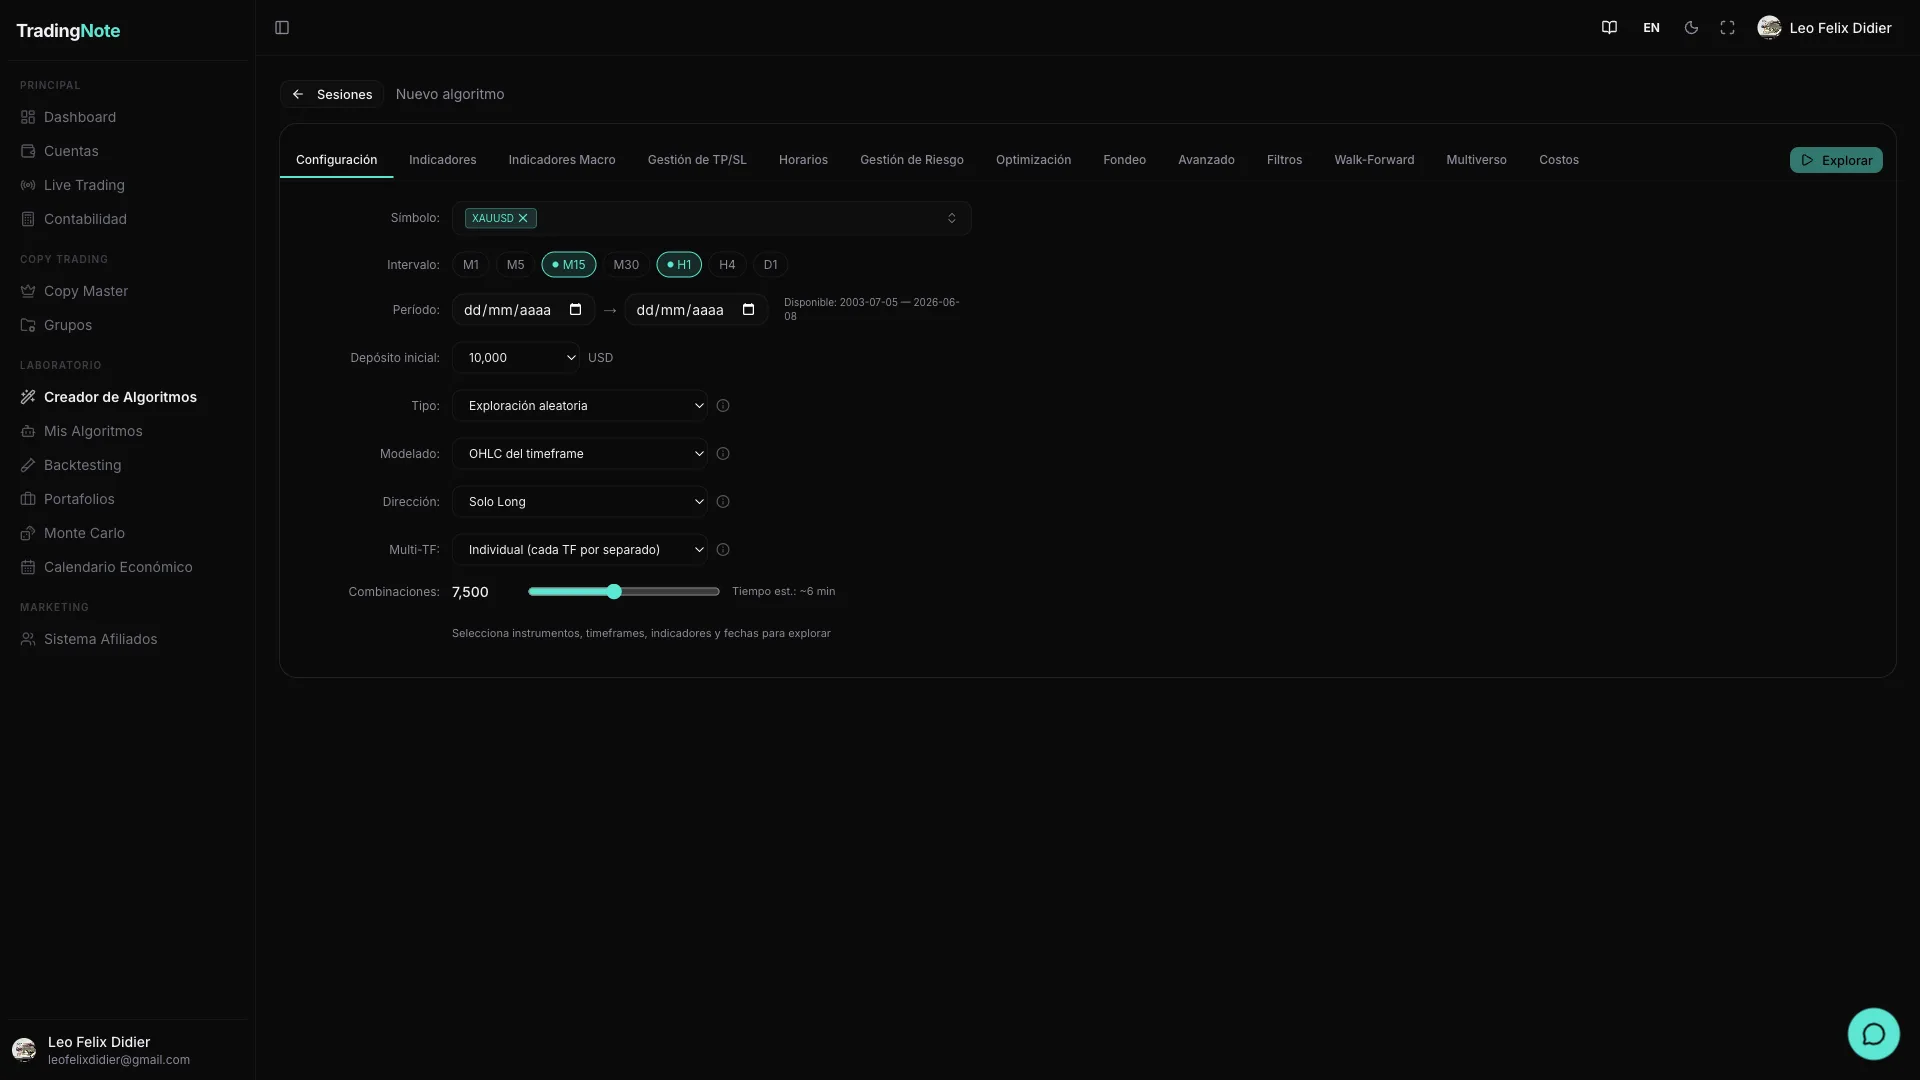
The «Configuration» tab is the first thing you see when you open an exploration session. Here you define the search universe: which asset to test, on which timeframe, with what capital, and which type of search to use. Nothing runs until you press «Explore»; you can change any field as many times as you like.
Instrument and data
These four fields determine which historical data the exploration works on. The more data and instruments you choose, the more complete (and slower) the sweep.
| Field | Description | Values / range | Default |
|---|---|---|---|
| Symbol | Asset or pair to test. Multi-select: you can choose several at once (~29 available: EURUSD, GBPUSD, USDJPY, USDCHF, USDCAD, AUDUSD, NZDUSD, EURJPY, GBPJPY, XAUUSD, XAGUSD, BTCUSD, ETHUSD, US30, USTEC, SPXUSD, NGAS, USOIL, among others). When you select one, the available date range is displayed. | ~29 assets | None (required) |
| Timeframe | Candle granularity used by the backtest. You can select several at once. | M1, M5, M15, M30, H1, H4, D1 | M15 and H1 |
| Period (dates) | Start and end of the backtesting range (YYYY-MM-DD). Bounded by the instrument's available data range. More history = more reliable backtest, but the exploration takes longer. | According to asset availability | Last 2 years of the selected asset |
| Initial deposit | Base capital for the backtest in USD. Affects the equity calculation, percentage drawdown, and position size if you use percentage risk management. | 1,000 · 2,000 · 5,000 · 10,000 · 25,000 · 50,000 · 100,000 · 200,000 · 500,000 · 1,000,000 USD | 10,000 USD |
If you select multiple symbols at once, the exploration tests all of them: the total time is multiplied by the number of selected assets.
Search type
The exploration engine can search in two very different ways. Choose the one that best fits your situation: if it's your first time exploring an asset, random search is the natural option for sweeping the possibility space. If you already know something works and want to refine it, genetic evolution takes the best ideas further.
| Mode | How it works | When to use it | Relative speed |
|---|---|---|---|
| Random | Generates thousands of indicator and parameter combinations completely at random and evaluates each one. | First exploration of an asset. You want a broad view of what might work. | Fast |
| Genetic evolution | Starts from the best-performing combinations and «crosses» and «mutates» them generation by generation, like natural selection. It progressively converges toward better solutions. | You already have a promising algorithm and want to fine-tune the parameters. Better for deep exploration. | Slower |
Backtest modeling
This setting controls how precise the simulation of each algorithm is. The higher the precision, the closer the fidelity to what would happen in the real market, but also the higher the computation time. There are four modes:
| Mode | How it evaluates each candle | Precision | Speed | Recommended for |
|---|---|---|---|---|
| Open prices only | A single evaluation per candle, at the opening price. | Low | Very fast | Quick pre-filtering of ideas. Not recommended for final results. |
| OHLC | Uses open, high, low, and close of each candle. Detects if SL or TP was hit within the candle. | Medium | Fast | Most explorations. Good balance between precision and speed. |
| OHLC + M1 | Uses OHLC of the chosen timeframe candles and additionally refines the intra-candle order using 1-minute data to know more precisely when each order was triggered. | High | Moderate | Verifying promising algorithms before passing them to DSR/WF validation. |
| Every tick | Simulates tick by tick: maximum fidelity, reproduces intra-candle movements with the highest possible detail. | Maximum | Very slow | Final validation of a specific algo. Do not use for large sweeps. |
The «tick» modeling can take very long in explorations with many combinations. Use it only to validate a specific algorithm you have already chosen, not for the initial sweep.
Direction
Defines whether the generated algorithms can trade long, short, or in both directions.
| Option | What it does | Default |
|---|---|---|
| Long (buys only) | The algorithm only opens buy positions. Useful for assets with a secular uptrend (indices, crypto). | Yes (default) |
| Short (sells only) | The algorithm only opens sell positions. Useful if you're looking for bearish or hedging strategies. | No |
| Both (long & short) | The algorithm can open in both directions, alternating between long and short based on the signal. More flexibility, but requires more data to validate properly. | No |
Multi-timeframe
This option only appears when you select two or more timeframes. It defines how they are combined in the exploration.
| Option | Behavior | Default |
|---|---|---|
| Individual | Each timeframe is explored separately. You get independent algorithms for M15 and for H1, for example. | Yes (default) |
| Combined | The system searches for algorithms that combine signals from multiple timeframes in the same algo (e.g., M15 entry confirmed by H1). | No |
| Both | Explores both in individual mode and combined mode and brings results from both. | No |
Combinations to test
The «combinations» slider controls how many different strategies the exploration will evaluate. More combinations = higher chance of finding something robust, but the process takes longer. The platform shows a time estimate before starting.
| Range | Default | When to use the maximum |
|---|---|---|
| 1,000 – 50,000 combinations | 10,000 | When you have narrowed down the space well (few indicators, few conditions) and want a high-quality exhaustive sweep. |
When does the «Explore» button become active?
The button stays disabled until all of these conditions are met at once:
- At least one symbol selected.
- At least one timeframe selected.
- Valid start and end dates (within the asset's available range).
- At least one indicator configured in the «Indicators» tab.
For your first exploration, leave the search set to «Random», the modeling to «OHLC», and the combinations at 10,000. It's fast and enough to see which indicators have potential in the asset you choose.
Once you master this tab, the next step is the «Indicators» tab, where you choose which technical signals you want the exploration to combine. The more indicators you activate, the more possible combinations, so start with 3 or 4 and expand later.