My Algorithms
The list of your saved algorithms, with their metrics and the robustness filters to know if they're solid.
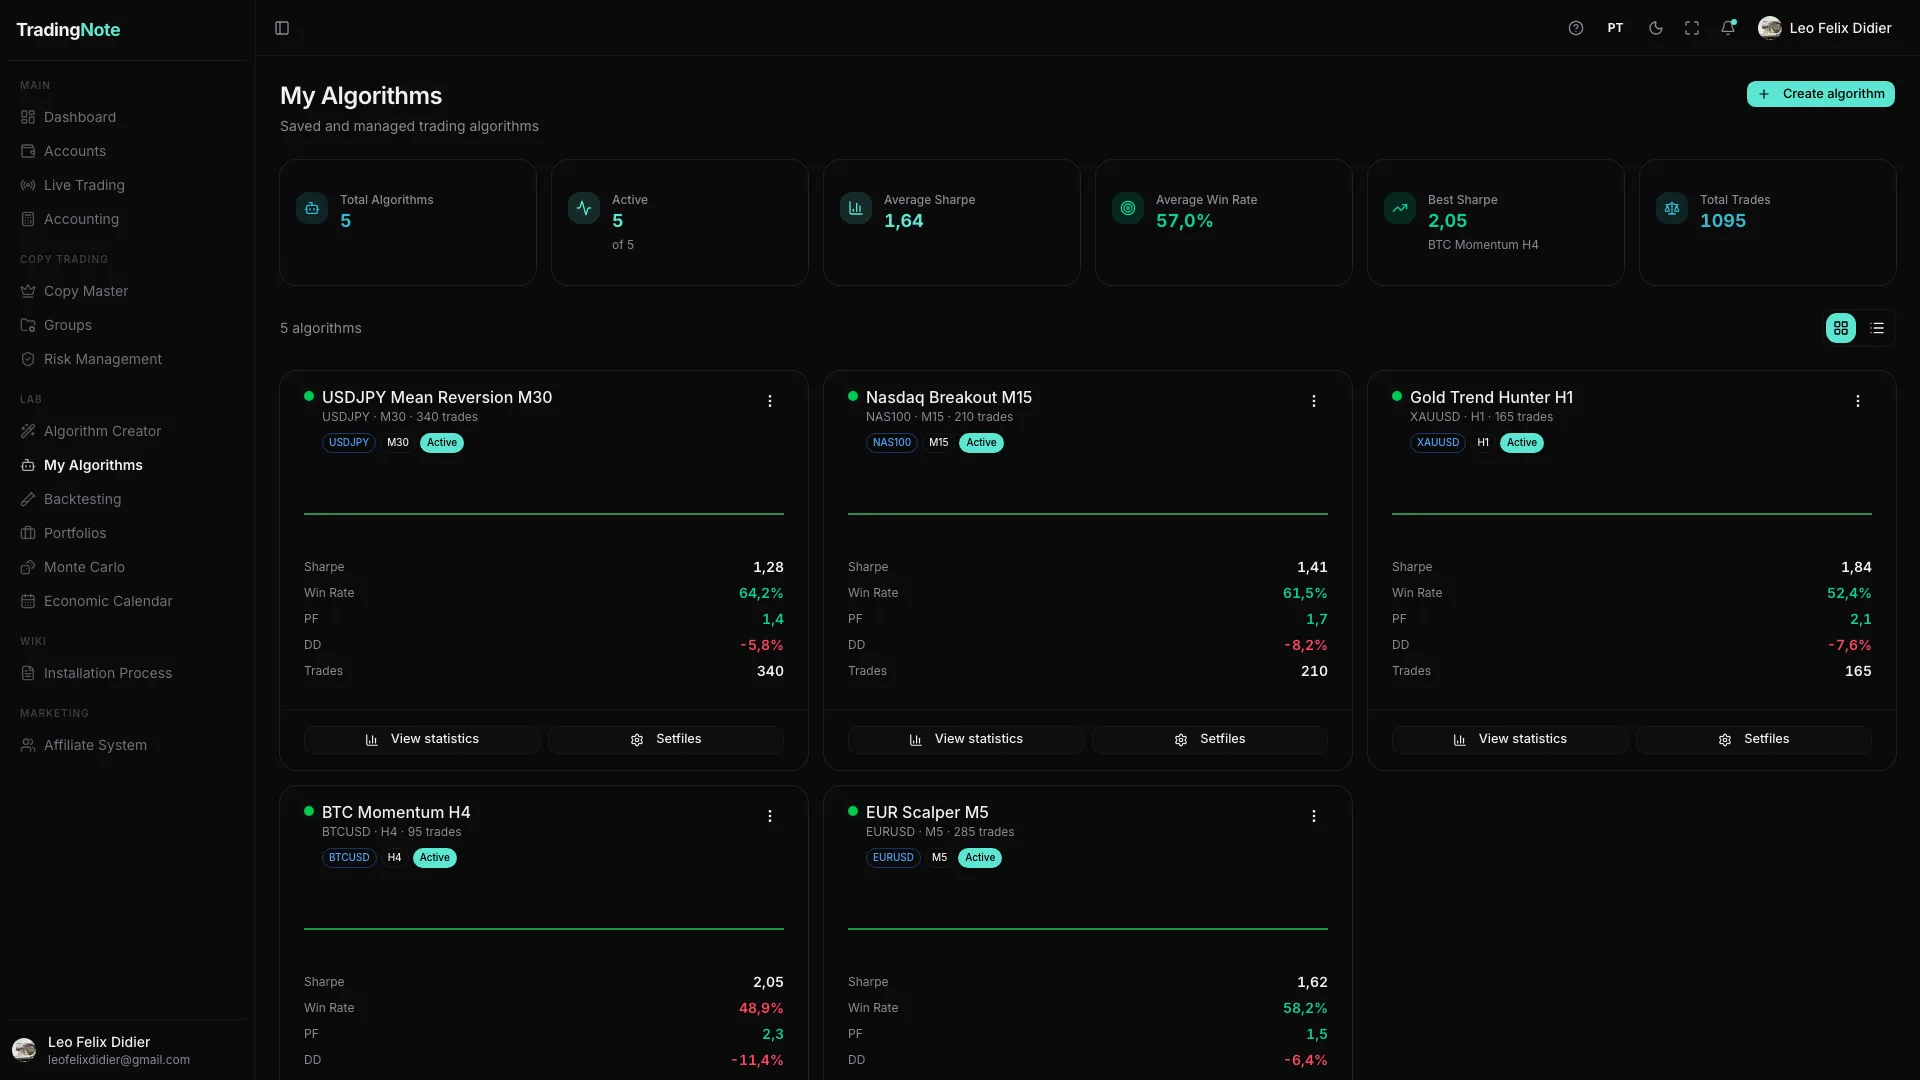
My Algorithms is your strategy library. All the algorithms you discovered with the Creator (or imported) live here. Each one comes with its «résumé»: how much it returns, how stable it is and whether it passed the robustness tests. From here you decide which ones to take to a portfolio or to trade live.
How to read the metrics
| Metric | What it means | Better when… |
|---|---|---|
| Sharpe | Risk-adjusted return | higher (>1 is good) |
| Win Rate | % of winning trades | higher |
| Profit Factor (PF) | gains ÷ losses | higher (>1 makes money) |
| Drawdown (DD) | the worst drop from a peak | lower (close to 0) |
| Trades | number of trades tested | higher (more reliable) |
The robustness filters (the most important part)
An algorithm performing well in the past doesn't mean it'll perform well in the future. That's why TradingNote runs each algorithm through three independent tests you open with «View statistics»:
- DSR (Deflated Sharpe Ratio): adjusts the Sharpe for the number of combinations tested. A high DSR means the result wasn't luck.
- Walk-Forward: tests the algorithm on periods it didn't «learn» from, simulating how it would have behaved in real time.
- Multiverse: runs thousands of variations to see if the algorithm keeps working under different conditions, or only worked in one lucky scenario.
Trust the algorithms that pass all three filters. A sky-high Sharpe that does NOT pass Multiverse is usually «overfitting»: a strategy fit to the past that breaks the moment the market changes.