Built-in IDE (code)
Write your own trading bots in Python inside TradingNote, with nothing to install. VS Code-style editor with built-in backtesting.
In addition to automatically discovering algorithms with the Explorer, TradingNote has a built-in IDE where you write the strategy in Python. It's for those who want full control: a specific logic that the random explorer would never find. The editor runs in the browser, has VS Code-style syntax highlighting (Monaco), built-in backtesting, and requires nothing installed on your computer.
You only need some basic Python knowledge. If you don't code, the random Explorer does the same job without code: launch an exploration and the platform searches for you.
Explorer or IDE? When to use each
| Situation | Use the Explorer | Use the IDE |
|---|---|---|
| I don't know how to code | ✓ | — |
| I have a specific logic idea | — | ✓ |
| I want to sweep thousands of parameter combos | ✓ | — |
| I want custom conditions / session-based logic | — | ✓ |
| I want multi-position or advanced risk management | — | ✓ |
| I want to iterate fast without thinking about code | ✓ | — |
How to create a strategy in the IDE
- 1
Go to the Algorithm Creator
In the main menu, click «Algorithm Creator» (Lab section). You'll see the list of your exploration sessions.
- 2
Press «New session»
Top right you'll find the «New session» button. This opens the creation wizard.
- 3
Choose «Custom development»
In the wizard you'll see two modes: «Random exploration» and «Custom development». Select the second to open the IDE.
- 4
Name it and open the IDE
Type a descriptive name for the session (e.g. «RSI + EMA EURUSD H1») and confirm. The IDE opens with a ready-to-edit template.
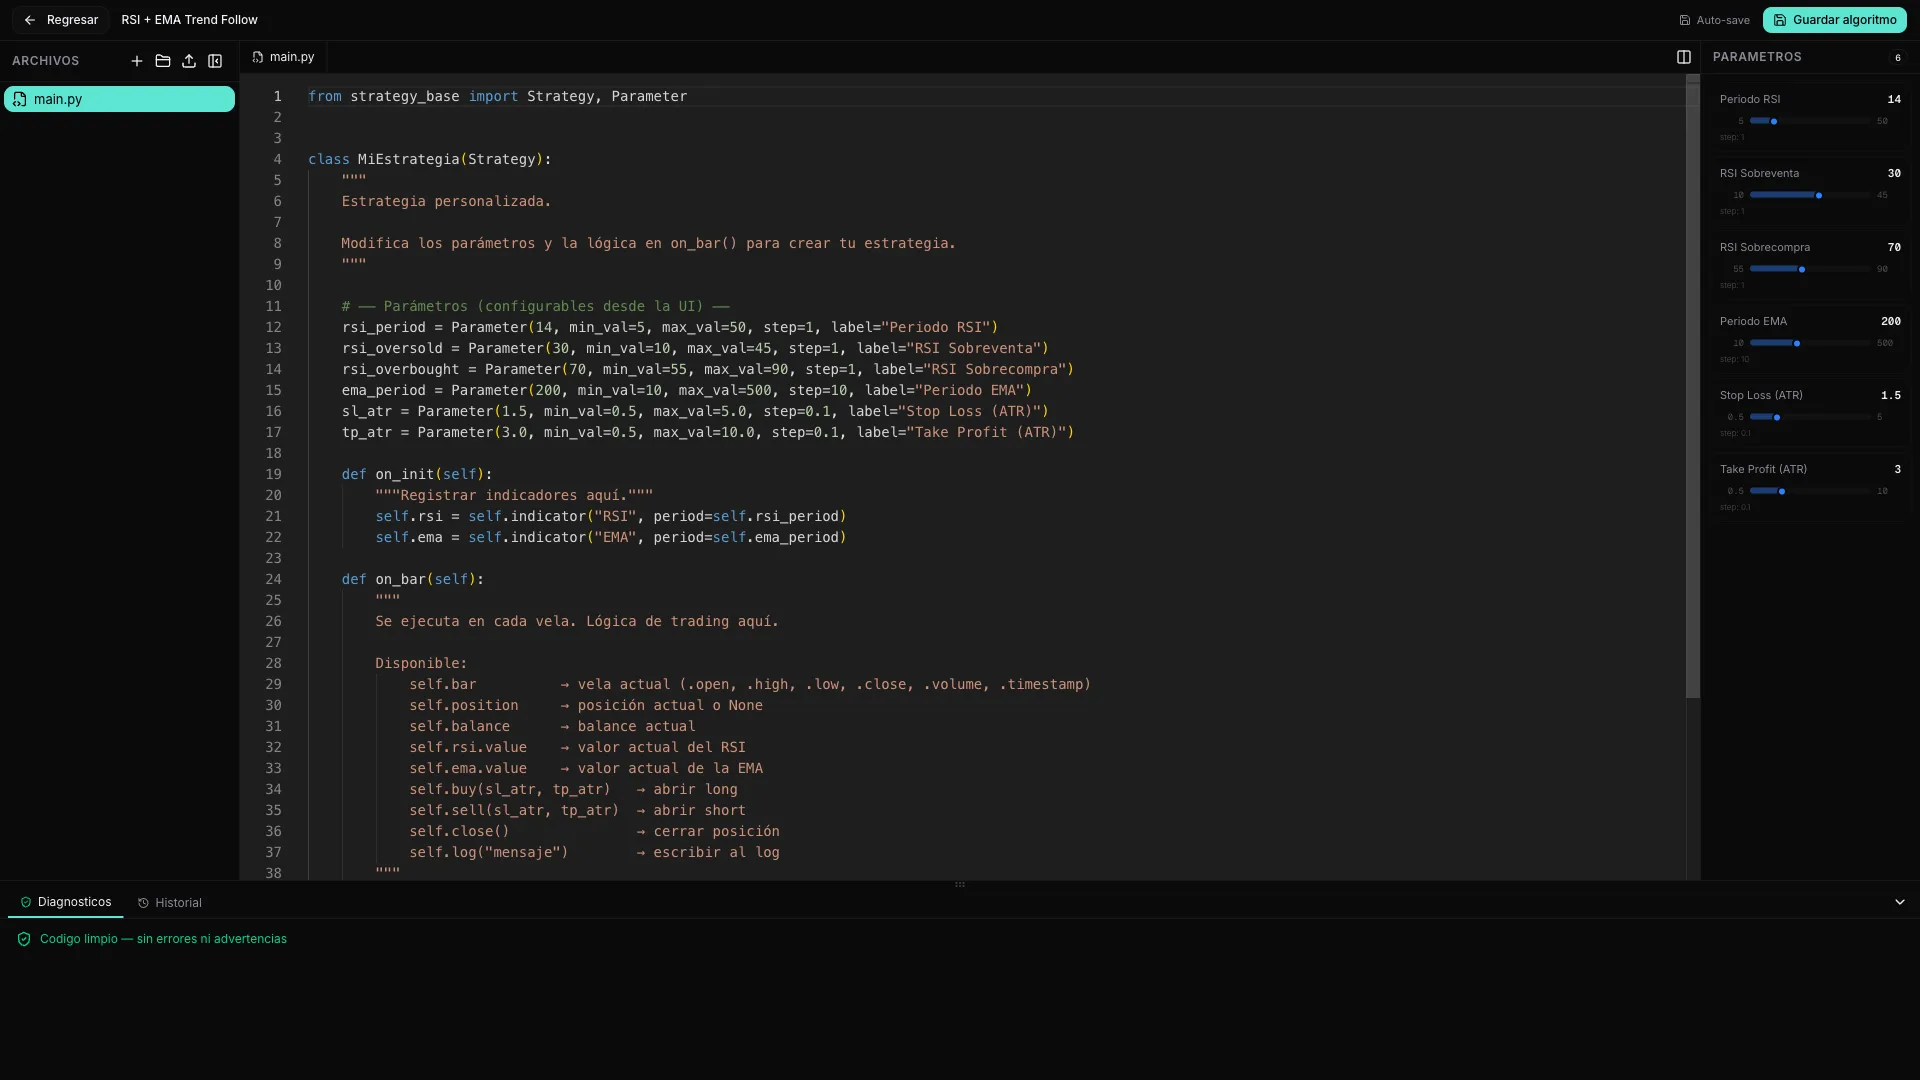
The IDE layout
The IDE is divided into four main panels that work together:
- Left — file tree: you can create multiple .py files and folders, drag, rename and delete them. The main.py file is mandatory and is the entry point of your strategy.
- Center — code editor: the Monaco editor (the same core as VS Code) with tabs and split view to see two files at once. Includes autocomplete for the TradingNote API.
- Right — parameters panel: sliders and controls that appear automatically when you use Parameter() in your code. Lets you adjust values without touching the code. See sub-page «Parameters, validation and history».
- Bottom — Diagnostics and History tabs: Diagnostics shows errors and warnings in real time as you type; History lists automatically saved versions of your code (every ~30 seconds).
Minimum structure of a strategy
Every strategy is a Python class that inherits from Strategy. It needs at least two methods: on_init() (runs once at startup, to register indicators and prepare variables) and on_bar() (runs on each new candle, where you write the logic to decide when to buy or sell). Below is the default template that appears when creating an IDE session:
from strategy_base import Strategy, Parameter

class MiEstrategia(Strategy):
    rsi_period = Parameter(14, min_val=5, max_val=50, step=1, label="Periodo RSI")
    rsi_oversold = Parameter(30, min_val=10, max_val=45, step=1, label="RSI Sobreventa")
    rsi_overbought = Parameter(70, min_val=55, max_val=90, step=1, label="RSI Sobrecompra")
    ema_period = Parameter(200, min_val=10, max_val=500, step=10, label="Periodo EMA")
    sl_atr = Parameter(1.5, min_val=0.5, max_val=5.0, step=0.1, label="Stop Loss (ATR)")
    tp_atr = Parameter(3.0, min_val=0.5, max_val=10.0, step=0.1, label="Take Profit (ATR)")

    def on_init(self):
        self.rsi = self.indicator("RSI", period=self.rsi_period)
        self.ema = self.indicator("EMA", period=self.ema_period)

    def on_bar(self):
        if not self.position:
            if self.rsi.value < self.rsi_oversold and self.bar.close > self.ema.value:
                self.buy(sl_atr=self.sl_atr, tp_atr=self.tp_atr)
                self.log(f"BUY @ {self.bar.close:.5f} | RSI={self.rsi.value:.1f}")
        else:
            if self.rsi.value > self.rsi_overbought:
self.close()Let's see what each part does. The Parameter() lines define adjustable controls that will appear as sliders in the IDE's right panel: rsi_period controls the RSI period (default 14), rsi_oversold and rsi_overbought are the entry and exit thresholds, ema_period defines the trend moving average, and sl_atr / tp_atr set the Stop Loss and Take Profit as ATR multiples. In on_init() the indicators that the strategy will use are registered: an RSI with the chosen period and an EMA with its period. In on_bar(), the main logic: if there's no open position and RSI is below the oversold threshold and the closing price is above the EMA (trend filter), a buy is executed with the configured stop loss and take profit, and a message is written to the log. If there's already an open position, it closes it as soon as RSI exceeds the overbought threshold.
Start with the template. Change a number (e.g. the RSI period from 14 to 20), save it as an algorithm, backtest it and see how the metrics change: it's the fastest way to build intuition about how parameters affect results.
Lifecycle methods
In addition to on_init() and on_bar(), you can override these optional methods to respond to key moments of execution:
| Method | When it runs | What it's for |
|---|---|---|
| on_init() | Once at the start of the backtest | Register indicators, initialize variables |
| on_bar() | On each closed candle | Main logic: entry and exit signals |
| on_tick(tick) | On each intra-candle tick (optional) | Scalping, intra-candle management, fine trailing stops |
| on_day_start() | First bar of each day | Daily resets, load previous day levels |
| on_day_end() | Last bar of each day | Close positions at end of day, save state |
| on_week_start() | First bar on Monday | Weekly resets, weekly parameter adjustments |
| on_week_end() | Last bar on Friday | Close at weekly close, avoid weekend risk |
| on_month_start() | First bar of the month | Monthly resets, asset rotation by month |
| on_month_end() | Last bar of the month | Close at monthly close, performance reports |
What you can read in your code (properties)
Inside any method you have access to these execution context properties. Full detail on indicators, orders and parameters is in the corresponding sub-pages.
| Property | What it is |
|---|---|
| self.bar | Current candle: open, high, low, close, volume, time |
| self.position | Main open position (None if there's none) |
| self.positions | List of all open positions |
| self.in_position | Boolean: True if there's at least one open position |
| self.position_count | Number of currently open positions |
| self.balance | Account balance (cash capital) |
| self.equity | Equity = balance + floating PnL of open positions |
| self.trades | History of closed trades in the backtest |
| self.data | Historical prices with relative indexes (self.data.close[-1] = previous candle) |
| self.symbol_info | Instrument specs: pip size, tick value, spread, etc. |
| self.account | Account info: base currency, leverage, broker |
| self.calendar | Economic calendar: upcoming macro events for the active symbol |
| self.log(msg) | Writes a message to the IDE diagnostics log |
The IDE runs in a sandbox: you can't import external libraries (numpy, pandas, requests…) or access the internet or the filesystem. You can only import from strategy_base import Strategy, Parameter and your own files within the project. What's allowed and what isn't is detailed in the parameters sub-page.
Save and backtest your strategy
Here's an important detail: the IDE has no «Run» button that executes the code inside the editor. The flow is different — you save the algorithm and the testing happens in the backtesting, where, thanks to the Parameter() values you declared, you can also tune them and discover which ones work best for that specific algorithm.
- 1
Write and let it save itself
Inside the IDE there's no «Run» button. You just write: the IDE saves your work automatically (every ~1.5 seconds of inactivity) and creates versions of your code every ~30 seconds. You can return to any previous version from the «History» tab at the bottom.
- 2
Save as algorithm
Press «Save algorithm» (top right). Your strategy is published to «My Algorithms» with the current parameters, exactly like an algorithm discovered by the Explorer. From there it gets backtested.
- 3
Backtest it on real data
In the backtest you choose symbol, timeframe, date range and capital, and the platform runs your code candle by candle including spread, commissions and swap. You get the equity curve, the list of operations and the key metrics: Sharpe, maximum drawdown, win rate, profit factor and TN Score.
- 4
Tune the parameters and find the best ones
Because your strategy declares Parameter(), in the backtesting you can move those parameters and compare the metrics to discover which values work best for that specific algorithm. It's how you fine-tune your own idea without rewriting the code.
- 5
Validate and trade
When the numbers convince you, validate it with Walk-Forward and Multiverse (see the Validation section) to rule out overfitting. If it passes, you can add it to a portfolio or take it to live trading like any other algorithm.
Keep learning
This article covers the IDE overview. The three sub-pages below go into detail on each specialized area:
- Indicators and data — how to register and use technical indicators (RSI, MACD, Bollinger, ATR and 25+ available), access historical prices with self.data and read the economic calendar from your code.
- Orders and exits — how to open long and short positions, place Stop Loss and Take Profit (in pips, ATR or exact price), use trailing stops, scale into a position (pyramid) and force partial or full closes.
- Parameters, validation and history — how Parameter() works in detail (types, ranges, labels), how the parameters panel is generated automatically, what's allowed to import in the sandbox and how to use version history to recover previous code.