IDE: indicators & data
How to register and read indicators in your code, and how to access prices and history.
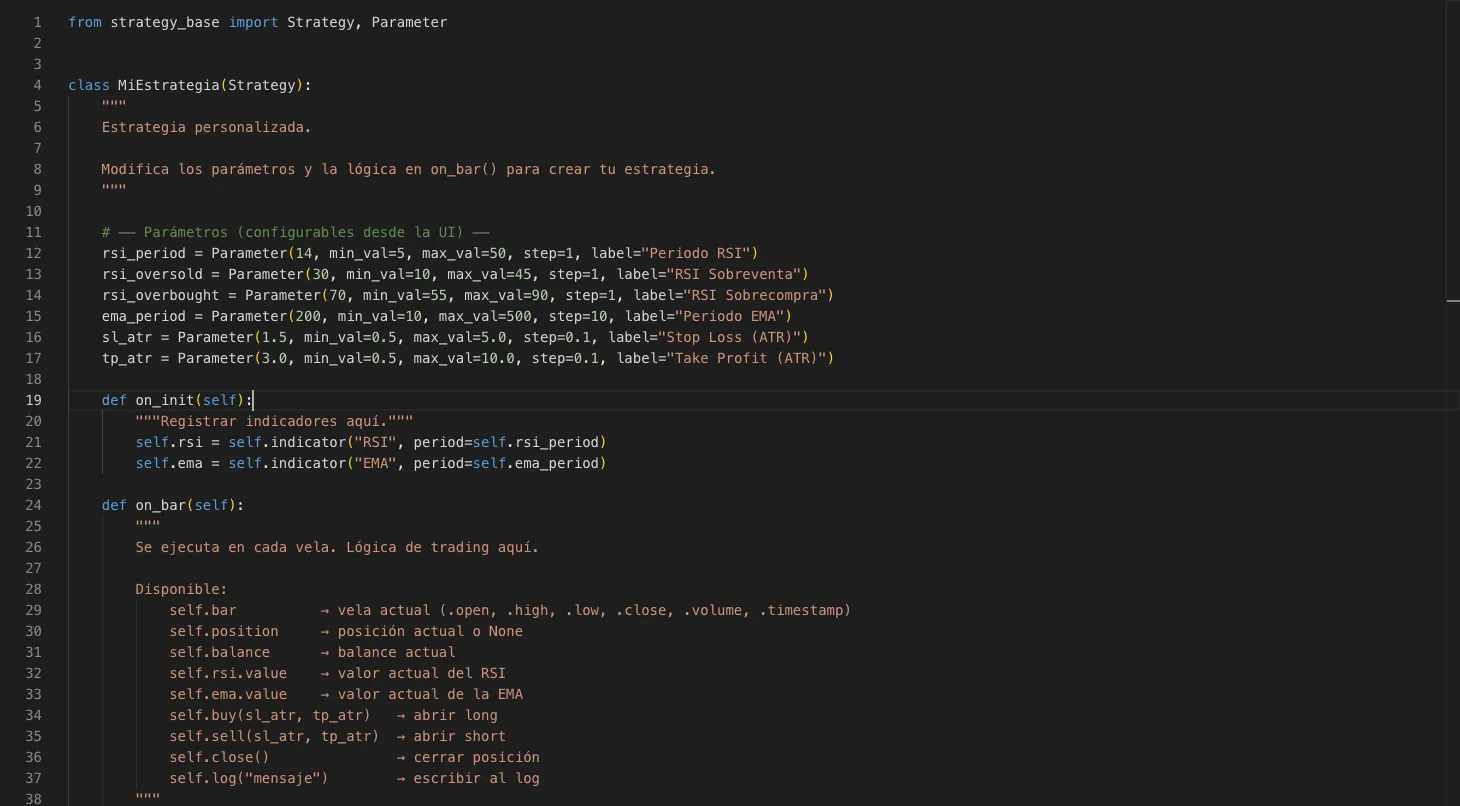
In the IDE you register indicators once in `on_init()` and then read their value on every bar inside `on_bar()`. This article is your reference guide: here you'll find the complete catalog of all 28 available indicators, how to read their outputs, and how to access the asset's price data.
Registering an indicator
Use `self.indicator("NAME", **parameters)` inside `on_init()` and save the result in an instance variable. The engine creates the indicator buffer once and updates it automatically on every bar.
def on_init(self):
    self.rsi = self.indicator("RSI", period=14)
    self.ema = self.indicator("EMA", period=200)
    self.macd = self.indicator("MACD", fast=12, slow=26, signal=9)
Reading an indicator value
| Access | Returns |
|---|---|
| .value | Indicator value on the current bar |
| .prev | Indicator value on the previous bar |
| .values(n) | List of the last n values (index 0 is the most recent) |
def on_bar(self):
    if self.rsi.value < 30:                              # RSI actual por debajo de 30
        ...
    if self.rsi.prev > 70 and self.rsi.value < 70:       # acaba de cruzar 70 a la baja
        ...
Indicators with multiple outputs
Some indicators return more than one line (upper/lower band, signal line, etc.). You access each output through its specific attribute instead of using `.value`.
self.bb = self.indicator("Bollinger", period=20, stdDev=2.0)
# self.bb.upper, self.bb.middle, self.bb.lower

self.macd = self.indicator("MACD", fast=12, slow=26, signal=9)
# self.macd.value (línea MACD), self.macd.signal, self.macd.histogram

self.ichi = self.indicator("Ichimoku", tenkan=9, kijun=26, senkou=52)
# self.ichi.tenkanSen, self.ichi.kijunSen, self.ichi.senkouA, self.ichi.senkouB
Indicator catalog (28)
| Name | Family | Parameters (with defaults) | Outputs / Notes |
|---|---|---|---|
| EMA | Trend | period=200 | .value |
| SMA | Trend | period=50 | .value |
| DEMA | Trend | period=21 | .value |
| TEMA | Trend | period=21 | .value |
| HMA | Trend | period=9 | .value — Hull Moving Average, less lag than EMA |
| WMA | Trend | period=20 | .value |
| KAMA | Trend | period=10, fast=2, slow=30 | .value — adapts to market volatility |
| SuperTrend | Trend | period=10, multiplier=3 | .value — level price; positive = bullish, negative = bearish |
| RSI | Momentum | period=14 | .value — range 0-100 |
| Stochastic | Momentum | period=14, dPeriod=3 | .k and .d — range 0-100 |
| MACD | Momentum | fast=12, slow=26, signal=9 | .value (MACD line), .signal, .histogram |
| CCI | Momentum | period=20 | .value — overbought >100, oversold <-100 |
| ROC | Momentum | period=12 | .value — rate of change in % |
| WilliamsR | Momentum | period=14 | .value — range -100 to 0; overbought >-20, oversold <-80 |
| Bollinger | Volatility | period=20, stdDev=2.0 | .upper, .middle, .lower |
| ATR | Volatility | period=14 | .value — average true range |
| Keltner | Volatility | period=20, multiplier=1.5 | .upper, .middle, .lower |
| Donchian | Volatility | period=20 | .upper (channel high), .lower (channel low) |
| StdDev | Volatility | period=20 | .value — standard deviation of closes |
| ADX | Trend strength | period=14 | .value (ADX), .plusDI, .minusDI |
| OBV | Volume | signal=20 | .value (cumulative OBV), .signal (EMA of OBV) |
| MFI | Volume | period=14 | .value — Money Flow Index, range 0-100 |
| VWAP | Volume | no parameters | .value — volume-weighted average price (resets each session) |
| Highest | Price | period=20 | .value — highest high of the last N bars |
| Lowest | Price | period=20 | .value — lowest low of the last N bars |
| PivotPoints | Price | no parameters | .pp (pivot), .r1/.r2 (resistances), .s1/.s2 (supports) |
| Ichimoku | Advanced | tenkan=9, kijun=26, senkou=52 | .tenkanSen, .kijunSen, .senkouA, .senkouB |
| ParabolicSAR | Advanced | afStart=0.02, afStep=0.02, afMax=0.2 | .value — stop price; below price in uptrend, above price in downtrend |
ATR is rarely used as a direct signal; the typical use is to size SL/TP dynamically (e.g. `sl_atr=1.5`). See how to do it in the «IDE: orders & exits» article.
Macro indicator (FRED)
You can bring any macroeconomic series from the FRED database as if it were a technical indicator: use `self.indicator("Macro", seriesId="CODE")`. Data respects the real publication date to avoid lookahead bias. It is useful for filtering signals based on macro context (volatility, interest rates, employment, etc.).
def on_init(self):
    self.vix = self.indicator("Macro", seriesId="VIXCLS")

def on_bar(self):
    if self.vix.value > 30:   # mercado nervioso: no operar
        return
Accessing prices and history (self.data and self.bar)
`self.bar` contains the current bar's data directly. `self.data` gives you access to the full series with a relative index: `[0]` is the current bar, `[-1]` the previous one, `[-5]` the one five bars ago.
self.bar.close          # cierre de la vela actual
self.bar.high, self.bar.low, self.bar.open, self.bar.volume

self.data.close[0]      # = self.bar.close
self.data.close[-1]     # cierre anterior
self.data.high[-3]      # máximo de hace 3 velas
self.data.bar_count # cuántas velas hay disponibles| Series method (self.data.close, .high, .low…) | What it computes |
|---|---|
| .values(n) | List of the last n values; index 0 = most recent |
| .highest(n) | Maximum value of the last n bars |
| .lowest(n) | Minimum value of the last n bars |
| .avg(n) | Average of the last n bars |
| .crossover(other) | True if the series just crossed above the given value or series |
| .crossunder(other) | True if the series just crossed below the given value or series |
resistencia = self.data.high.highest(20)
if self.data.close.crossover(self.ema.value):   # precio cruza la EMA al alza
self.buy(sl_atr=1.5, tp_atr=3.0)Always register indicators in `on_init()`, never inside `on_bar()`. If you do it in `on_bar()`, the engine would create a new indicator on every bar and it would never have enough history to compute its value.
Indicator names are case-sensitive: "RSI", "EMA", "Bollinger"… use them exactly as they appear in the catalog. An incorrect name will raise an error when starting the backtest.
With indicators and price data under control, the next step is learning how to place orders, manage SL/TP, and close positions. Continue in «IDE: orders & exits».