Results & Neural Explorer
Read each candidate's metrics, compare, watch the search in 3D and save the good algorithms.
As soon as the exploration starts producing candidates — and again when it finishes — the results panel fills up with the algorithms that passed the quality filters, sorted from best to worst by TN Score. You don't have to wait until everything is done: you can check the first results while the search keeps running in the background.
The summary at the top (KPIs)
Just above the list of candidates you'll find a bar with the key indicators of the exploration's status. It lets you know at a glance how far the search has progressed and how good the best findings are so far.
- Progress (%): what percentage of the exploration the engine has completed. When it hits 100% the search is done.
- Combinations tested: the total number of candidate algorithms already evaluated over the historical data.
- Candidates that passed the filters: how many of the tested ones met the minimum quality criteria and appear in the panel.
- Best Sharpe found: the highest Sharpe Ratio value among all current candidates. It's a quick reference for the quality ceiling.
- Average win rate: the average of the hit rate across all passing candidates. It gives you an idea of the general profile of the found algorithms.
- If you filtered by a specific symbol, you'll also see averages for Sharpe, maximum drawdown, profit factor and total trades for that subset.
Filter and sort
Above the list there's a controls bar so you can focus on what matters:
- Symbol pills: if you explored several instruments at once, a pill appears for each one. Click one to show only the candidates for that pair or asset.
- «Walk-Forward only»: shows only the candidates that passed the Walk-Forward validation, which measures whether the algorithm behaves well in periods it didn't use for training.
- «Multiverse only»: filters to show only those that passed the Multiverse, a test that checks whether performance holds up under small parameter variations.
- Grid (cards) or list (table) view: choose how you prefer to see the candidates. Cards are more visual; the table is better for comparing numbers at a glance.
Activate «Walk-Forward only» and «Multiverse only» at the same time to keep only the robust elite: algorithms that not only worked in the past, but also passed two independent generalization tests.
Anatomy of a strategy card
Each card in the results panel condenses the most important information about a candidate. Here's what you'll see in it:
- Ranking (#1 = best): the position number within the exploration, sorted by TN Score. #1 is the best candidate according to the platform's overall evaluation.
- Editable name: each candidate gets an automatic name, but you can change it by double-clicking on it. Useful if you want to quickly tell your favorites apart.
- Pair, timeframe and indicator badges: small colored tags that tell you which instrument and timeframe this algorithm operates on, and which indicators it uses in its signals.
- Mini equity curve chart: a thumbnail view of how the capital grew (or fell) during the backtest. Green when the curve rises consistently; red when there are drops or excessive volatility.
- Metrics at the bottom: a set of key figures (Sharpe, drawdown, win rate, profit factor, number of trades, TN Score) so you can compare candidates without opening any of them.
- Click on the card: opens the detailed viewer for that candidate, where you can see the full equity curve, trade history, exact algorithm parameters and validation results if they were run.
Metrics glossary
The metrics you see on the cards and in the detailed viewer have precise meanings. This table helps you interpret them:
| Metric | What it tells you | How to read it |
|---|---|---|
| Sharpe Ratio | Risk-adjusted return: how much you earn for each unit of volatility. | >1 is decent, >2 is very good. But always validate: a high Sharpe with few trades isn't reliable. |
| Sortino | Like Sharpe, but only penalizes drops (negative volatility), not upside. | The higher the better. It's fairer than Sharpe for strategies with long winning streaks. |
| Calmar | Annualized return divided by the worst drop (maximum drawdown). | >1 means annual return exceeds the worst drawdown. >2 is excellent. |
| Max drawdown (DD) | The largest percentage drop from a peak to a trough during the backtest. | Lower is better. A 5% DD is very manageable; a 40% one is emotionally hard to stomach in live trading. |
| Win Rate | Percentage of trades that closed in the green. | A high win rate with a bad risk/reward ratio can still lose money. Always evaluate it alongside Profit Factor. |
| Profit Factor (PF) | Total gross profit divided by total gross loss. | >1 means the algorithm earns more than it loses. >1.5 is solid; >2 is very good. |
| Expectancy | Average expected gain per trade, in monetary terms. | Positive is good. The higher it is, the more «money per click» the algorithm produces on average. |
| Recovery Factor | How much the algorithm earns relative to its worst historical drawdown. | >3 means total profit is at least 3× the worst drawdown. Higher = better ability to recover. |
| TN Score | TradingNote's own score that summarizes the overall quality of the algorithm by weighting multiple metrics. | From 0 to 100. It's the most practical metric for sorting and comparing candidates at a glance. |
No metric is worth anything on its own. A high Sharpe with few trades (e.g., 20 trades) isn't statistically reliable. Look for consistency + enough trade volume + Walk-Forward and Multiverse validation before trusting a candidate.
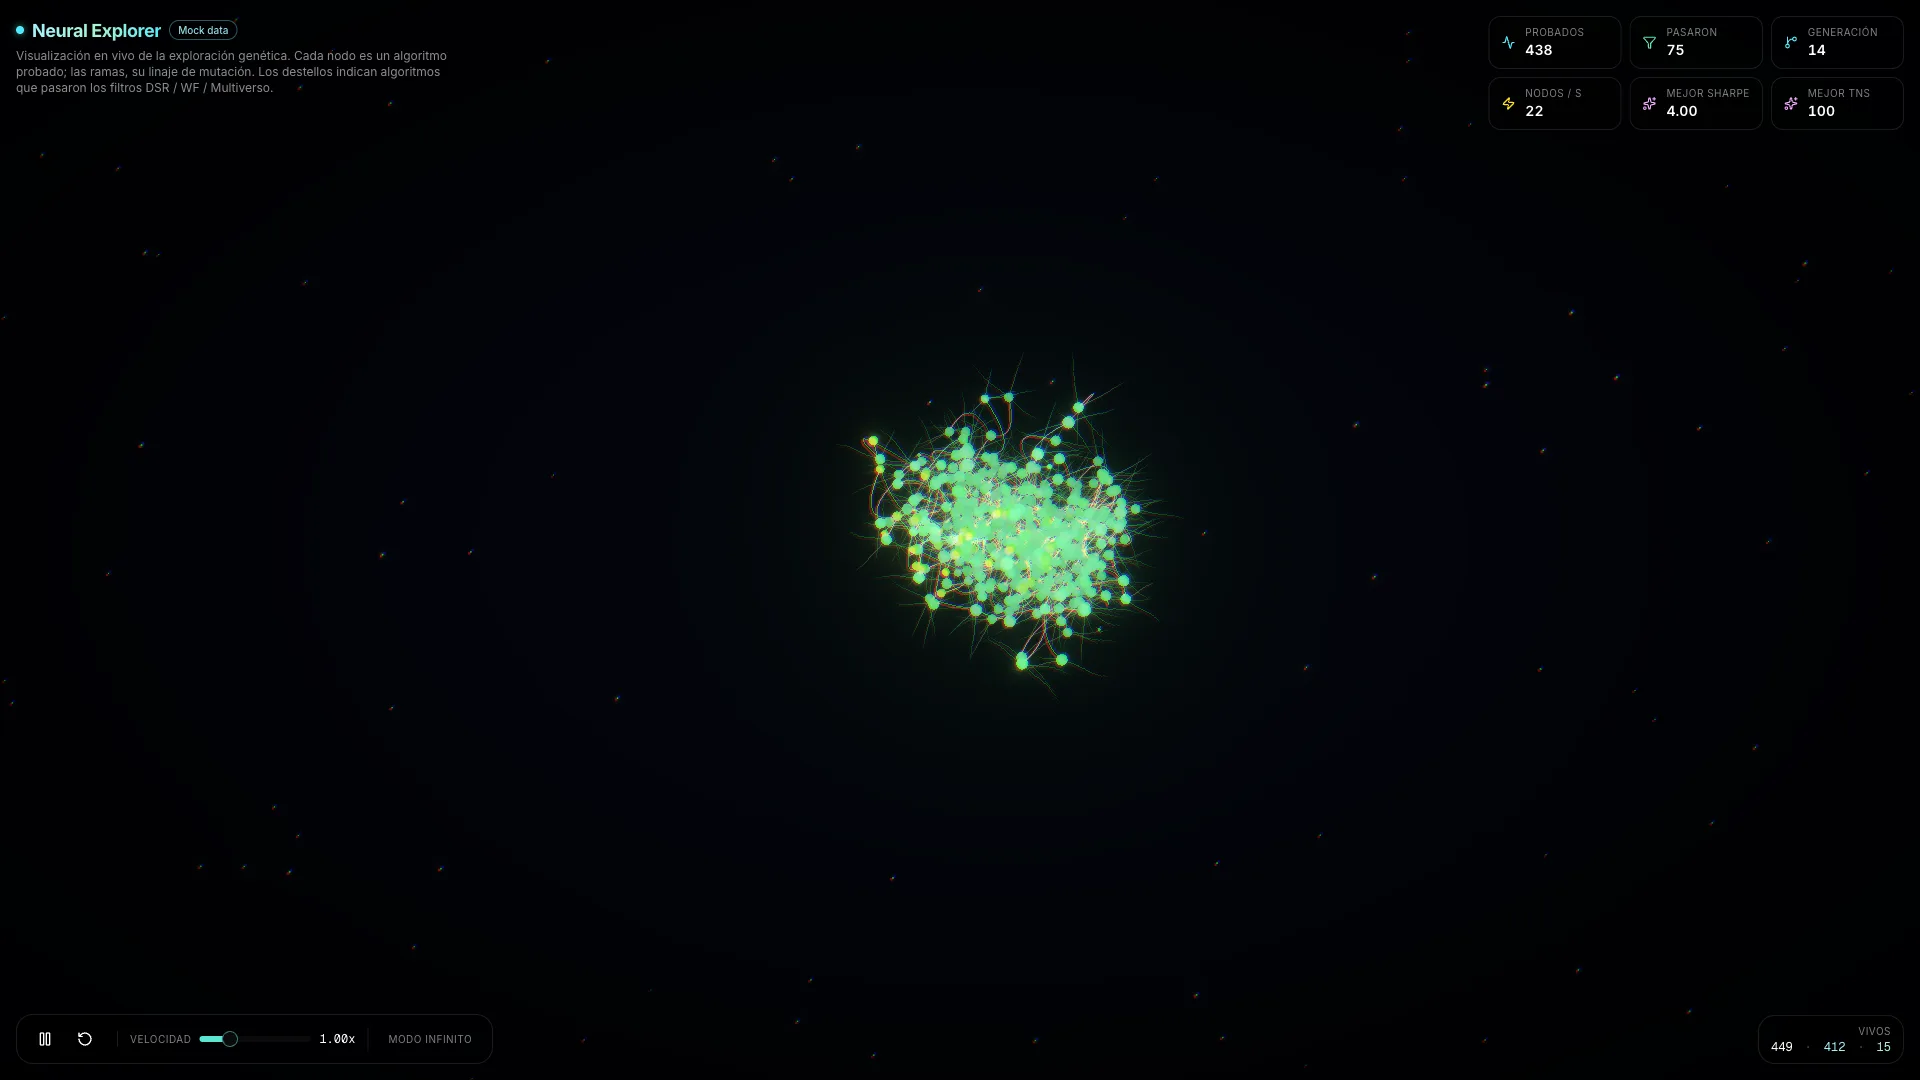
Neural Explorer (3D view)
The Neural Explorer is a three-dimensional visualization of the genetic exploration, rendered as a living neural network. You can open it from the «Neural Explorer» button on the algorithm creator page while the exploration is running (or after it finishes).
- Each node is a candidate algorithm that was evaluated. Its color and size reflect its quality: bright, large nodes = better fitness / TN Score.
- The branches (axons) connect parents to children: they show the mutation lineage, i.e., which algorithm mutated to give rise to which. You can «see» how the genetic search evolves.
- The light flashes that travel along the axons represent the algorithms that passed the quality filters (DSR, Walk-Forward, Multiverse): the best candidates «light up» the network.
- The camera automatically rotates around the node cloud. You can click and drag to rotate it yourself, and scroll to zoom in or out.
- The HUD panel (top left) shows live stats: current generation, total nodes, live candidates, best Sharpe. It also has speed controls (0.25× to 3×) and a pause button.
- The Neural Explorer is decorative and exploratory: it's designed so you can «feel» the genetic search intuitively, not to make decisions. Decisions are made in the results panel.
Save an algorithm
When you find a candidate you're convinced by, you can save it to your personal library to study it in depth and eventually trade it. The process is deliberate: saving is not trading.
- 1
Review the metrics and, if you want, validate it first
Open the candidate by clicking on its card. Check the equity curve, trade history and detailed metrics. If the exploration ran Walk-Forward or Multiverse on it, you'll see those results too. Once satisfied, continue.
- 2
Press «Save to My Algorithms»
You'll find the button both on the card (corner actions menu) and inside the detailed viewer. When you press it, the candidate becomes an active algorithm in your account, with status «Draft» until you activate it.
- 3
Find it in «My Algorithms»
From that point, the algorithm lives in the «My Algorithms» section in the side menu. From there you can re-backtest it on different periods or instruments, run DSR, Walk-Forward and Multiverse, compare it with others and, when you're ready, add it to a portfolio or set it up for live trading.
Saving is not trading. Saving just puts the algorithm in your library for you to study without rushing. Taking it to live trading is a later, deliberate step: it requires adding it to a portfolio, assigning capital and activating it, with all the risk controls that entails.
Once saved, the natural next step is to deepen the analysis in «My Algorithms»: there you can launch the advanced validations (DSR, Walk-Forward, Multiverse) that determine whether the algorithm generalizes well out of sample. Only those that pass those tests should be considered serious candidates for a live portfolio.