Indicators & ranges
Choose which technical and macro indicators the exploration sweeps and set each parameter's range.
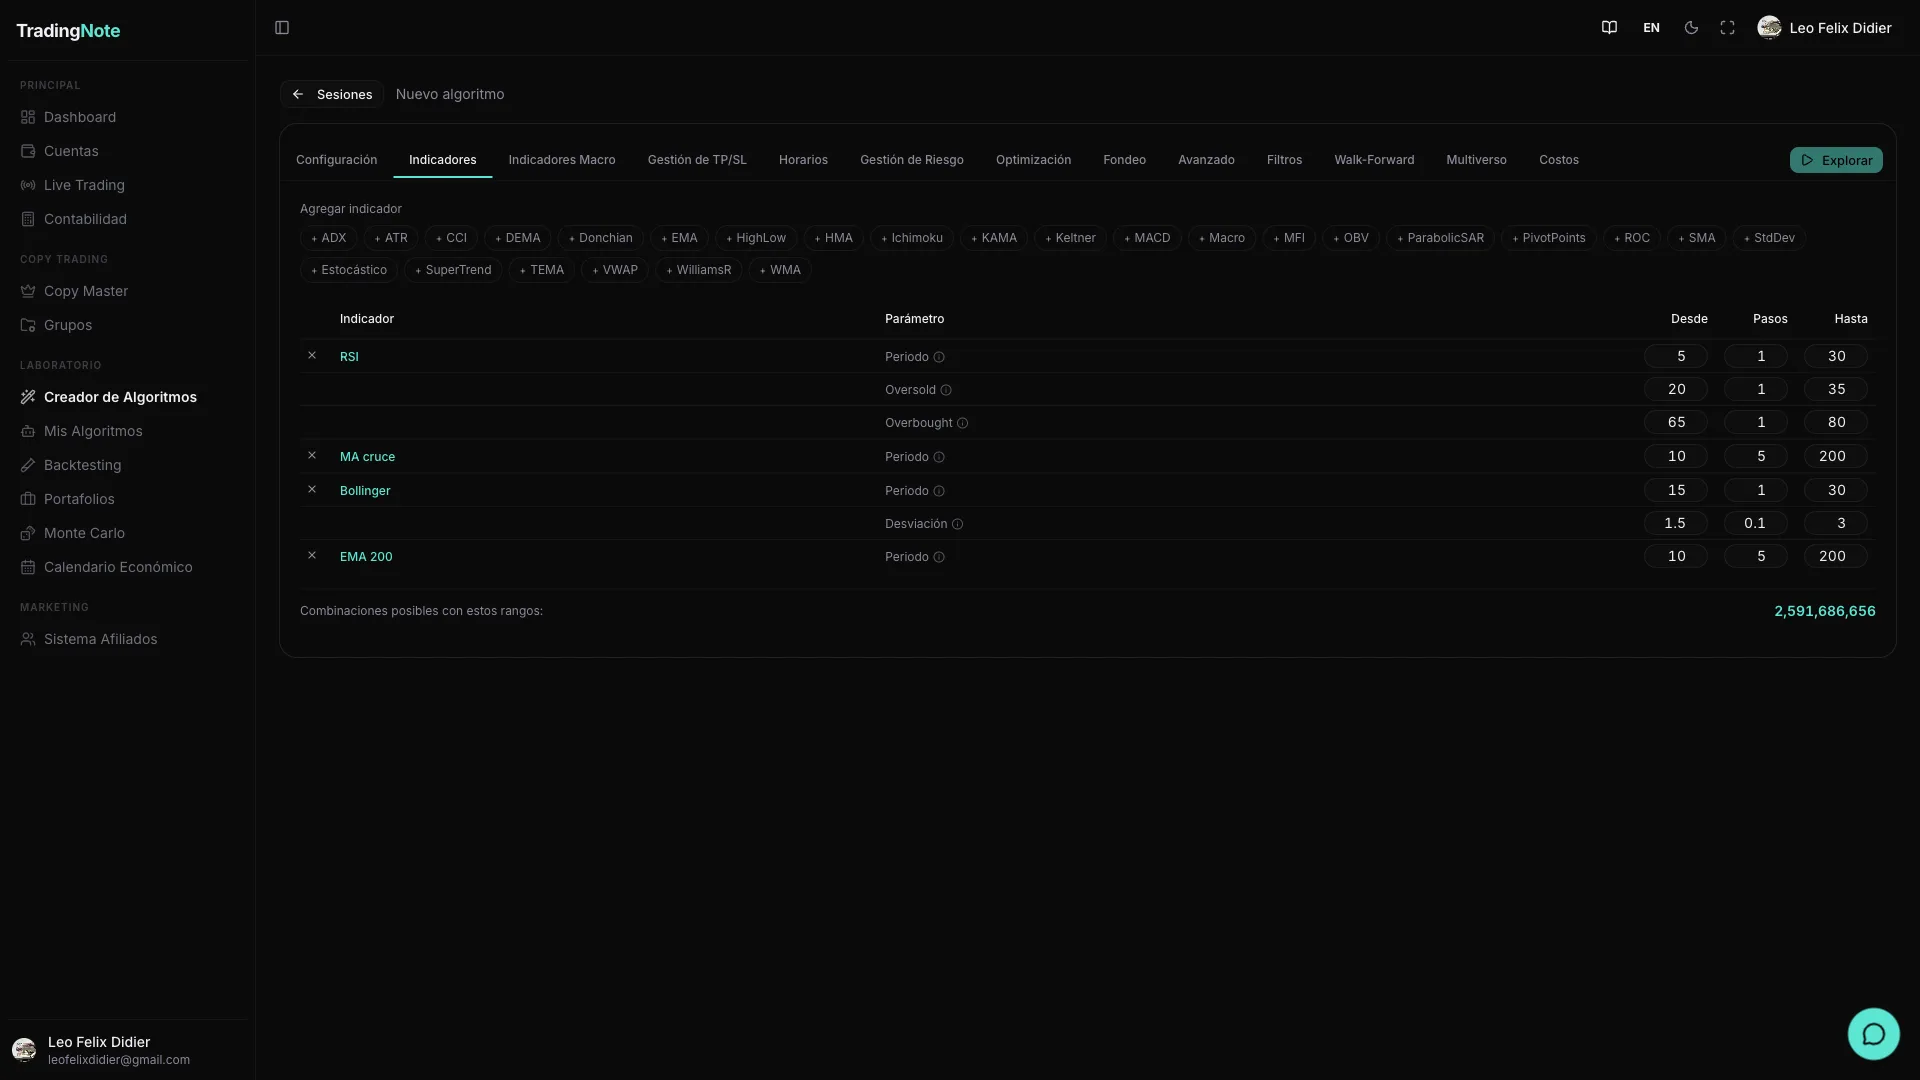
The exploration doesn't invent indicators out of thin air: it tests combinations of the ones you enable in the «Indicators» panel. Your selection is the search universe. If you don't activate RSI, the engine won't try it. If you activate it with a wide range, it will try many period values. The more indicators you enable and the wider the ranges, the more possible combinations — and the longer the exploration will take.
How the range sweep works
Each indicator has numerical parameters (periods, multipliers, thresholds…). For each parameter you define three values: «From», «Step» and «To». The exploration takes the starting value and increments it by equal steps until it reaches the final value, testing each intermediate point. For example: RSI period From 7, Step 7, To 28 → tests values 7, 14, 21 and 28 (four possibilities).
Indicador   Parâmetro      Desde  Pasos  Hasta   Valores que prueba
──────────  ─────────────  ─────  ─────  ─────   ──────────────────────
RSI         Período           7      7     28    7, 14, 21, 28  (4 pts)
EMA         Período          50     50    200    50, 100, 150, 200  (4 pts)
─────────────────────────────────────────────────────────────────────────
Combinaciones posibles = 4 × 4 = 16Widening the ranges multiplies combinations exponentially. An RSI with 4 values × an EMA with 4 values × an ATR with 4 values = 64 combinations with just those three. Watch the counter before launching to avoid starting an exploration that takes hours with no real benefit.
Available technical indicators (28)
The 28 indicators are organized in seven families. Enable only those that make sense for the logic you want to explore.
| Indicator | Family | Parameters & defaults | What it does |
|---|---|---|---|
| EMA | Trend | period 200 | Exponential moving average; filters noise and follows price direction. |
| SMA | Trend | period 50 | Simple moving average; classic dynamic support/resistance reference. |
| DEMA | Trend | period 21 | Double EMA; reacts faster to price than the standard EMA. |
| TEMA | Trend | period 21 | Triple EMA; reduces lag to a minimum at the cost of higher noise sensitivity. |
| HMA | Trend | period 9 | Hull MA; near-zero lag and smoother than TEMA; useful for detecting fast trend changes. |
| WMA | Trend | period 20 | Linearly weighted average; gives more weight to recent candles without spiking lag. |
| KAMA | Trend | period 10, fast 2, slow 30 | Kaufman Adaptive MA; speeds up in trends and slows in ranges according to market efficiency. |
| SuperTrend | Trend | period 10, multiplier 3 | ATR band over price; gives buy/sell signal when price crosses the channel. |
| RSI | Momentum | period 14 | 0-100 oscillator of relative change speed; identifies overbought/oversold. |
| Stochastic | Momentum | period 14, dPeriod 3 | 0-100 oscillator comparing close to recent range; works well in ranging markets. |
| MACD | Momentum | fast 12, slow 26, signal 9 | Smoothed EMA difference; gives signals on signal line crossovers and histogram. |
| CCI | Momentum | period 20 | Commodity Channel Index; measures price deviation from its statistical mean. |
| ROC | Momentum | period 12 | Rate of Change; percentage price change compared to N periods ago. |
| Williams %R | Momentum | period 14 | Oscillator from -100 to 0; similar to Stochastic but inverted, signals momentum exhaustion. |
| Bollinger Bands | Volatility | period 20, stdDev 2.0 | Standard deviation bands around the SMA; detects volatility expansions and contractions. |
| ATR | Volatility | period 14 | Average True Range; measures average candle range. Mainly used to size SL/TP, not as an entry signal. |
| Keltner Channel | Volatility | period 20, multiplier 1.5 | EMA ± ATR channel; complements Bollinger to detect volatility breakouts or reversals. |
| Donchian Channel | Volatility | period 20 | High and low of the last N periods; foundation of classic breakout systems. |
| StdDev | Volatility | period 20 | Price standard deviation; quantifies the pure dispersion of returns. |
| ADX | Trend strength | period 14 | Average Directional Index; measures trend strength regardless of direction (0 = range, >25 = strong trend). |
| OBV | Volume | signal 20 | On Balance Volume; accumulates volume by price direction to detect divergences. |
| MFI | Volume | period 14 | Money Flow Index; volume-weighted RSI; more reliable for assets with real volume data. |
| VWAP | Volume | no parameters | Volume Weighted Average Price; intraday volume-weighted average price; key institutional reference. |
| Highest | Price | period 20 | Highest value of last N periods; useful for detecting new highs (bullish breakouts). |
| Lowest | Price | period 20 | Lowest value of last N periods; useful for detecting new lows (bearish breakouts). |
| Pivot Points | Price | no parameters | Support/resistance levels calculated from the previous OHLC; widely used in futures and indices. |
| Ichimoku | Advanced | tenkan 9, kijun 26, senkou 52 | Complete support/resistance, trend and momentum system in one cloud; requires higher timeframes to be reliable. |
| Parabolic SAR | Advanced | afStart 0.02, afStep 0.02, afMax 0.2 | Accelerating dots that follow price; excellent as a trailing stop in strong trends. |
ATR doesn't usually generate entry signals on its own; its real value is in dynamically sizing the Stop Loss and Take Profit. Enable it mainly when using «SL/TP as ATR multiple» in the Risk tab.
Entry/exit thresholds
Bounded oscillators (RSI, MFI, Stochastic, Williams %R) also have thresholds that determine when the signal fires: for example, RSI < 30 signals oversold (possible long entry) and RSI > 70 signals overbought (possible short entry). The exploration can sweep these thresholds just like periods: you define a «From / Step / To» range for each threshold and the engine tests all combinations. This lets you discover whether the algo works better with conservative thresholds (20/80) or aggressive ones (40/60), without you having to decide manually.
Macro indicators (FRED)
In addition to technical indicators, you can add macroeconomic series as market context filters. They are organized in eleven categories and come from the FRED database of the U.S. Federal Reserve. Their purpose is to let the algorithm trade only when the macro environment favors the strategy: for example, avoiding trading during periods of very high VIX, or entering only when the rate differential is moving the dollar in a certain direction.
| Category | Example series | Typical frequency |
|---|---|---|
| Volatility & risk | VIX (VIXCLS), MOVE (Treasury volatility) | Daily |
| US interest rates | Treasury 10Y (DGS10), 2Y (DGS2), Fed Funds (FEDFUNDS) | Daily / Monthly |
| International rates | ECB deposit rate, BoJ policy rate, BoE base rate | Monthly |
| Dollar & FX | DXY (DTWEXBGS), USD/JPY spot (DEXJPUS) | Daily |
| Inflation | CPI (CPIAUCSL), PCE (PCEPI), PPI (PPIACO) | Monthly |
| Labor market | Nonfarm payrolls (PAYEMS), unemployment (UNRATE) | Monthly |
| Economic activity | GDP, Manufacturing PMI (MANEMP), retail sales | Quarterly / Monthly |
| Monetary & liquidity | M2 (M2SL), monetary base (BOGMBASE), TED spread | Weekly / Monthly |
| Commodities | WTI oil (DCOILWTICO), gold (GOLDAMGBD228NLBM), copper | Daily |
| Sentiment | Michigan Consumer Sentiment (UMCSENT), business confidence | Monthly |
| Calculated derivatives | Yield curve (10Y-2Y), high yield spread, copper/gold ratio | Daily |
Macro data respects the actual publication date (anti-lookahead): the backtest never «sees» data before it existed in real life. If January's CPI was published on February 14th, the algo receives it on February 14th, not before.
Less is more. 2-3 well-chosen indicators usually produce more robust and faster-to-explore algorithms than 8 active indicators. More indicators increase the risk of overfitting: the algo «memorizes» past noise instead of learning real patterns.
Once you've defined your indicators and ranges, the next step is to configure exits, risk and trading hours. Find it in the «Exits, risk & hours» article.